Top Secret on How to Trade Boom and Crash

The top secret on how to trade Boom and Crash indices relies heavily on technical analysis, can feel quite daunting to novice traders. However, by understanding the basic principles of trading synthetic indices, and by employing a solid risk management strategy, trading boom and crash might be an effective way to grow your equity account.
We’re going to give you the top secrets on how to trade boom and crash. We’ll explain what the boom the crash index is, how to trade boom and crash indices, and concepts that you need to understand, like boom and crash support and resistance.
While there is no single strategy that will provide you with a 100% chance of success, we’re going to provide you with some simple strategies that might help you trade boom and crash successfully. We’ll also answer some popular boom and crash FAQs at the end of the article.
But before we dive into boom and crash trading secrets, let’s first answer the simple question of what are boom and crash indices?
What are the boom and crash indices?
You may have heard of the boom and crash index. When trying to explain what are the top secret on how to trade Boom and Crash, it’s impossible not to expand the Boom 500, Boom 1000, Crash 500, and Crash 1000. These are synthetic indices used in foreign exchange (FX or forex) trading. Those numbers refer to the rise and fall (on average, 1000 to 500 ticks) of price movements.
A tick is the minimum increment that prices can change on the market and denotes the smallest possible price movement to the right of the decimal. Each increment in the price digit is a tick. The tick size is the price change between the consecutive bid and sell prices of the asset being traded.
Key Takeaways:
- Boom and crash indices are known for their sudden spikes. Hikes and drops occur rapidly and can be as big as 50+ pips.
- The boom phase occurs when an upside spike results in sudden price increases.
- The crash phase is when prices decrease extremely fast. Positions can close at the end of a spike, resulting in heavy losses quickly.
The difference between Boom 1000, Boom 500, Crash 1000, and Crash 500
The boom index (1000 – 500) is the average of a spike in price ranges occurring every 1000 – 500 ticks.
- On average, a spike occurs every 1000 ticks In Boom 1000, whereas a spike occurs every 500 ticks in Boom 500.
- The Boom 1000 index is more volatile than the Boom 500 index.
The crash index (1000 – 500) is the average price decline that occurs every 1000 – 500 ticks.
- In the Crash 1000 index, a price drop occurs, on average, every 1000 ticks.
- In the Crash 500 index, a price drop occurs roughly every 500 ticks.
- Unlike the Boom index, the Crash 500 is more volatile than the Crash 1000 index.
How to trade Boom and Crash?
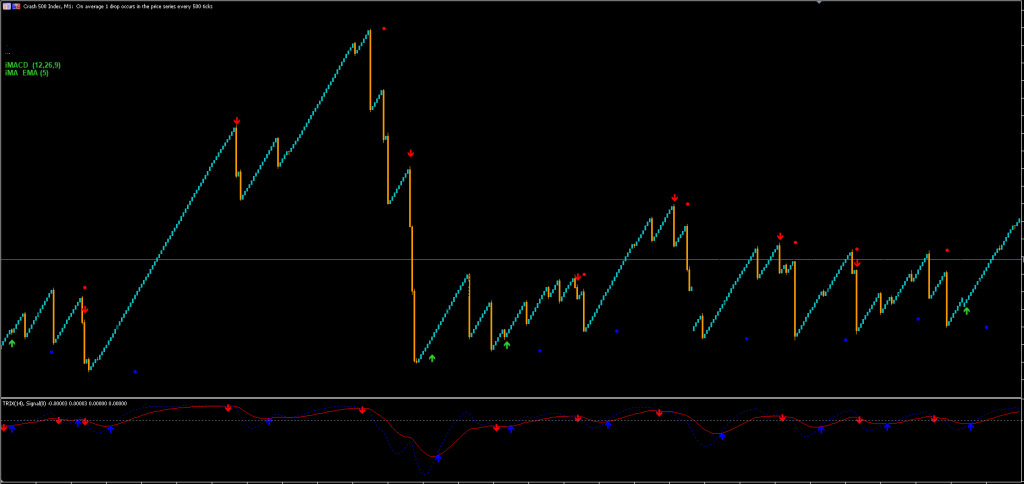
Unlike forex pairs, trading boom and crash relies purely on price action charts and technical analysis without any influence from news, current events, or policy changes. The boom and crash index is completely independent of the currency and commodity markets.
Even though the synthetic indices market behaves like a traditional monetary market, it is simulated. The behaviour of the indices is created from randomly generated numbers.
Top Secret on How to Trade Boom and Crash Indices
To possibly trade successfully in the boom and crash market requires developing a strategy. An important part of boom and crash index trading is knowing that regardless of whether you are using the Boom 1000, Boom 500, Crash 1000, or Crash 500 indices, you should apply the same trading principles to each.
How do you trade boom and crash indices advantageously?
Several trading strategies can be used to trade the boom and crash market, from medium to long term ones, scalping, day trading, swing trading, and position trading, though scalping and day trading are amongst the most common.
A trading strategy should be chosen based on a trader’s personal trading style, trading psychology, market exposure, and knowledge, along with trading experience.
Technical analysis and a solid understanding of market structure are the foundational factors for successful boom and crash trading. Indicators should be used only once you have first analyzed the market.
Boom and Crash SUPPORT and RESISTANCE
What exactly do we mean by support and resistance in boom and crash trading?
If you want to trade in boom and crash, you need to understand support and resistance levels. Understanding them helps you identify at which point a price will stop and most likely change direction.
- A support zone or level is the lowest price point where a downtrend is expected to pause before reversing upwards again or breaking through and continuing a downwards movement.
- A resistance level is a price ceiling; the highest point a price hits before moving downwards.
There are many methods and technical tools you can use to inform your market entry based on support and resistance levels. Among them are trendlines, Moving averages, and Bollinger Bands. These indicators help you recognize a support level when the indicator line is lower than the market price and conversely, a resistance level when the indicator line is higher than the market price.
Boom and Crash Trading Strategies
So, you may be asking yourself at this point what are the top secret on how to trade Boom and Crash strategies? We’ll take you through some popular strategies that you can employ to successfully trade the boom and crash market.
What is the best boom and crash index strategy?
Price Action strategy
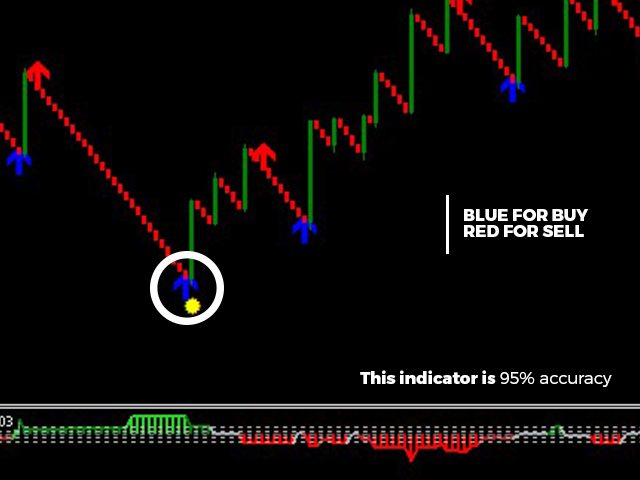
One of the key factors in successfully trading boom and crash is understanding price action. Analyzing candlestick movements, drawing support and resistance levels, and demand and supply zones, will all help identify bullish and bearish patterns. This, along with your favorite indicators, and finding patterns and trends in different timeframes, will probably enable you to determine the best entry and exit positions on a trade.
Risk Management strategy
Low-risk management is needed in this type of market to minimize significant losses. It’s important to know when to close a trade, minimize your loss, and look for the next entry point. It is better to close your position with a small loss than to lose a large amount of capital on a trade gone wrong. View trading as a serious business that involves investing. Stick to a careful strategy based on market structure and technical analyses. Develop a target-based trading strategy, with a daily profit target that you can stick to. Your strategy should include factors such as lot size, conditions that need to be met to enter or exit a trade, and what to do if you close in red.
No-risk Demo Account strategy
Practice and patience are both important to developing an effective trading style. Before investing real money in boom and crash trading, it’s worth using a free demo account to practice. If you don’t have a demo account, you can open one here. You can test various trading strategies, monitor your results, and see what works best for you.
Top secrets on how to trade Boom and Crash – Conclusion
You might be asking yourself why you should trade synthetic indices rather than real assets?
- For one, you can trade synthetic indices like boom and crash 24 hours a day, 7 days a week
- Secondly, external factors like market and economic news do not affect the synthetic indices market
- Boom and crash indices are consistently volatile, so they can be traded at all hours of day or night
- When trading synthetic indices like boom and crash on MT5, there is no minimum deposit needed
- You can practice trading boom and crash with a demo account before risking any real money.
One of the things that you need to be aware of before investing in boom and crash trading is the need for a strict risk-management strategy. The boom and crash market is extremely volatile and can result in significant losses if you’re not careful. our today’s article regarding the top secret on how to trade Boom and Crash will hopefully guide and help you choose the right path on your trading adventure.
Frequently Asked Questions
You cannot trade synthetic indices on MT4, but you can trade boom and crash, along with other synthetic indices, on MT5.
Stop-loss is designed to stop the trading process automatically when a price movement gets out of hand. But the speed of the boom and crash market means SL orders can find it hard to respond quickly enough. When trading the boom and crash market, you must be aware of stop-loss hunting. Stop-loss hunting is when you enter a trade, with your stop-loss set, and then the market breaks in reaches your stop-loss, and then reverses. To avoid stop-loss hunting, be patient and try not to place your stop-losses too close to your support or resistance levels. When trading against the trend, make sure to set a good risk management strategy and determine your position size based on your technical analysis.
